viernes, 15 de marzo de 2013

Oil: for and against

The Oil


The oil is an organic substance consists essentially of hydrocarbons extracted from the interior of the Earth, hydrocarbons that are obtained from the fossilized organic moieties such as dinosaurs extinct .. At the same time, despite being an organic substance, oil is a complex compound which are not edible and can cause severe damage to both the health of living beings and the planet.

The importance of water

The importance of water


   The most important use of water in agriculture is for irrigation, which is a key component to produce enough food. Irrigation takes up to 90% of water withdrawn in some developing countries and significant proportions in more economically developed countries (United States, 30% of freshwater usage is for irrigation). It takes around 3,000 litres of water, converted from liquid to vapour, to produce enough food to satisfy one person's daily dietary need. This is a considerable amount, when compared to that required for drinking, which is between two and five litres. To produce food for the 6.5 billion or so people who inhabit the planet today requires the water that would fill a canal ten metres deep, 100 metres wide and 7.1 million kilometres long – that's enough to circle the globe 180 times.

Agriculture As A System


Agriculture As A System


The agriculture functions by this way:


Crop Farming


Crop Farming


      People have been growing crops all through history. As people traveled from one continent to another, they took seeds with them so that they could grow food in their new country. Early settlers knew that they needed to be able to grow their own food if they wanted to live.
Today, farmers know much more about growing crops than they did then. Different crops are grown so that the farmer will get larger fruit or larger seeds. There is a lot of science in agriculture today. Growing a better grain, fruit or vegetable means that the farmer needs to know: 1. What kind of plant will grow well in their soil, 2. How to get the soil ready for planting, 3. How to grow, harvest and store the crop, 4. How to get rid of weeds and crop pests, and 5. How to sell it once it's been grown.
Three-fourths of the world eats grain products as an important food source. Grains are the oldest kind of crop. Most grains belong to the grass family and are grown for their seeds. Some of these are corn, wheat, rice, barley, oats and rye. Grains are usually used to feed people, but sometimes they are used to feed animals.

Farmers today depend on science a lot. They study the soil to be sure it is right for the crops they plan to grow. A farmer tests his soil and uses chemicals to fix or add what might be missing from it.
Crops depend on water. A good farmer grows crops that use the water that is available. Crops might use a combination of rainfall and irrigation. A farmer wouldn’t grow a crop that needed tons of water in a place where it never rains. He wouldn’t plant a crop that needs to be drier on land that is marshy or doesn’t drain rainwater well.


The picture to the right is an example of irrigation on a farm. Irrigation is when a farmer has to spray water on his crops because the rain isn't enough. These sprayers travel over the fields on wheels, spraying as they move.


Watering the Crops


Farmers also have to watch for pests. Pests might be plant diseases, weeds, or insects that can ruin a crop. The farmer has to know what is ruining the crop and what to do about it. This might mean putting just the right kind and right amount of pesticide on it. Farmers use scientists and agricultural experts to help them figure these things out.
Sometimes birds and rodents will eat the seeds or plants. In the past, scarecrows were used to scare away these animals. 

Crop farmers have to:


Get the soil ready to plant [make a place for the seeds or plants to be planted.]
Plant the crop.
Cultivate the crop. [Pull out and bury the weeds between plants.]
Pick the crop and separate it into its usable parts.
Sell the crop, store it, or make it into food. Some crops become feed for animals and are stored in silos.

Physical factors affecting farming

Physical factors affecting farming


Several factors affect farming:


The farming system


The farming system


In this chart we can see the farming system:


Types of farming

Types of farming


- Lácteos
-Carne de Vacuno
- Cerdo
- Aves de corral y huevos
- Cualquier otro animal
- Campo de cultivos
- Futa y verduras
- Invernaderos y viveros de flores
 

Primary economic activity world map

Primary economic activity world map


Gross domestic product of countries in the world


Gross domestic product of countries in the world


 Countries of the world sorted by their gross domestic product (GDP) to values ​​of purchasing power parity (PPP), the sum of all goods and services produced by a country in a year, in relation to purchasing power parity (PPP .) This is an economic indicator introduced in the early nineties by the International Monetary Fund in a realistic way to compare living standards across countries, taking into account the per capita gross domestic product in terms of cost of living in each country.

The PPP is one of the most appropriate for comparing living standards that the gross domestic product per capita, as it takes into account changes in prices. This indicator eliminates money illusion linked to changes in exchange rates, so that an appreciation or depreciation of a currency will not change the purchasing power parity of a country, since the inhabitants of this country receive their wages and make purchases in the same currency. Ie, allows the exchange rates between currencies are such as to allow a coin has the same purchasing power anywhere in the world.

Bar chart of income percapita of the countries E.U.

Bar chart of income percapita of the countries E.U.


    This inequality is evident in the diagram. The first bar indicates the level of income per capita in 1820 and the second in 1998, according to estimates by Maddison. The numbers in brackets located above the second bar corresponds to the average annual growth rate of the region (between 1820 and 1998).

Highlights three main elements:

       * All regions were poor in 1820.
       * All regions have experienced some economic progress.
       * Today's rich regions experienced by far the greatest economic progress.
 

Physical and political map of America


Physical map of America

 
North America:


South America:


Political map of America

 
North America:


 South America:


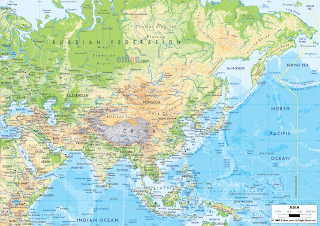
Physical and political of Asia


Physical map of Asia


In English:


In Spanish:


Political map of Asia


In English: 
                                                 
 
In Spanish: